
The national advertising market gained 10% year-over-year when factoring out the World Cup in July 2018.
But, it was again Digital that drove the dollars, new data from Standard Media Index show. Radio was flat, while National TV was up.
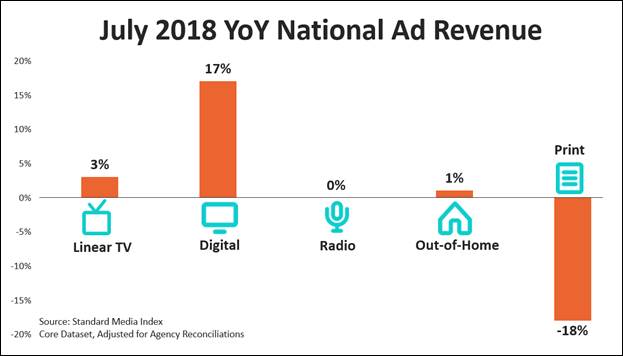
Looking across platforms, Digital was the strongest performer this quarter, growing 17%. That was followed by National TV at 3% (excluding the World Cup), Out-of-Home at 1%, Radio flat, and Print at -18%.
National Television Results
National Television increased in July, thanks to Cable programming, which rose 5% year-over-year, while Broadcast fell 1%, when excluding the World Cup from both.
The 3% rise in revenue coincided with an 2% increase in the number of 30-second spots. While paid unit costs dipped, that was offset by a 16% reduction in the number of unpaid spots — also known as makegoods, or ADUs.
“The decline in ADUs is a positive sign for the industry, indicating that programs are delivering the expected audience figures this month,” said SMI CEO James Fennessy. “National TV declined in the previous three months (April-June), and it’s encouraging to see this trend reverse towards growth.”
In July, the Upfront market grew 5%, while the Scatter market grew 1%.
Entertainment
Entertainment Television revenue increased 3% year-over-year in July with Prime-time Original Programming up 8%. Three of the major broadcast networks gained revenue from Prime-time Original Programming this month: NBC at 8%, ABC at 18%, and CBS at 21%. FOX, which aired the World Cup Tournament through much of July, saw a decline in revenue from Prime-time Originals that coincided with a decline in spots for this programming.
Two-thirds of the revenue from Prime-time Originals in July was from the Reality subgrenre. Prime-time Original Reality shows grew 3%, as revenue from ABC’s “The Bachelorette” and NBC’s “America’s Got Talent” increased 35% and 42% respectively.
News
Cable News continues to be a boon for National TV in July. The five cable news networks – FOX News, CNN, MSNBC, CNBC, and HLN – grew a combined 18% YoY for the quarter. Among the networks, MSNBC has been a powerhouse, growing 44% YoY. Nevertheless, FOX News continues to charge the highest prices for spots during new episodes
Meanwhile, Broadcast News was positive in July, marking the first month of YoY gains in 2018 for the genre. Combined, ABC, NBC, and CBS grew revenue from news programming by 8% in July
Among TV Network Groups, Comcast has 35% share in news, followed by 21st Century FOX at 16%, The Walt Disney Co. at 16%, Time Warner at 16%, and CBS at 8%.
Sports
Revenue from Sports increased 20% in July YoY, although that is entirely due to the World Cup. When excluding the tournament, Sports revenue is down -6%.
Looking at the full World Cup Tournament, which ran from June 14 to July 15, in-game revenue is down -29% from the 2014 games. Breaking that down, the English-language version, which aired FOX and FS1, is down -18% despite an 85% increase in the number of 30-second spots. Meanwhile, the Spanish-language version, which aired on Telemundo, is down -36% as the number of spots fell -26%.
Among TV Network Groups, The Walt Disney Co. has 33% share in sports, followed by Comcast at 33%, 21st Century FOX at 23% and CBS at 3%.
Advertisers by Category
Across National TV, the Prescription Pharmaceutical industry spent the most on advertising this month, growing 26% YoY. Rounding out the top five were: Auto (5%), Food, Produce & Dairy (-10%), Insurance (12%), and Quick Serve Restaurants (19%)
The retail industry was uncharacteristically spending on advertising in July. While July is considered “off-season” for retail, all three retail subcategories – department stores, specialty retailers, and other (online & convenience) retailers – overspent historical norms. This is a partial response to favorable economic conditions allowing retailers to open their open their wallets to attract more customers. Altogether, the combined retail category increased spend compared to last July by 16%.
| Biggest National TV
Advertiser Categories (July 2018) |
YoY Change in Ad Spend |
| Prescription Pharmaceuticals | 26% |
| Auto | 5% |
| Food, Produce & Dairy | -10% |
| Insurance | 12% |
| Quick Serve Restaurants | 19% |
Looking at advertiser categories across all platforms – including TV, Digital, Radio, Out-of-Home, and Print – the top four categories increased spend compared to July last year. The Telecommunications industry was the largest spender in July, increasing 5% year-over-year. That is followed by Auto (22%), Prescription Pharmaceuticals (37%), Quick Serve Restaurants (51%), and Food, Produce & Dairy (-2%).
| Biggest Advertiser Categories
Across Platforms (July 2018) |
YoY Change in Ad Spend |
| Telecommunications | 5% |
| Auto | 22% |
| Prescription Pharmaceuticals | 37% |
| Quick Serve Restaurants | 51% |
| Food, Produce & Dairy | -2% |


