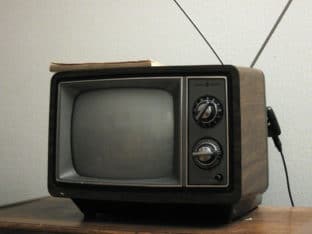
For years, there was no question as to what the most commonly owned technology product was, and is.
In fact, the television remains the No. 1 tech product owned by Americans.
This could change very soon, a newly released Consumer Technology Association (CTA) study finds.
The smartphone continues to experience “meteoric popularity” and are now owned in 87% of U.S. homes. This makes the smartphone second only to televisions, at 96% ownership.
The figures come from the CTA’s 20th Consumer Technology Ownership and Market Potential Study, which also shows that, for the first time, the top three most-frequently owned tech products are now screen devices.
Laptops, trailing only TVs and smartphones, reached their highest ownership level ever at 72%.
“‘The Three Screens’ – TVs, smartphones and notebook computers – now dominate the kinds of tech devices Americans have in their home, speaking to consumers’ desire to be connected and entertained, anytime and anywhere,” said Steve Koenig, the CTA’s VP/Market Research. “The rapid ascent of smartphone ownership in U.S. households exemplifies the versatility of these devices — for communication, for entertainment, for productivity and more. Because of that, it’s possible we’ll see smartphone ownership in the U.S. match that of TVs within the next five years.”
Emerging Tech – Smart Speakers, Smartwatches and More
Among new, emerging tech categories, smart speakers including the Amazon Echo and Google Home have nearly tripled in ownership rate to reach 22%* of American households, making it one of the fastest-adopted technologies since tablets. Smartwatch adoption continues to grow, with 18% of U.S. households now owning at least one of the devices — an increase of six percentage points over last year.
Additionally, ownership rates of drones and virtual reality (VR) headsets were measured at 10% and 11% of households, respectively.
Consumers Remain Focused on The Big Screen
Next-gen screen technologies and the availability of larger screen sizes drove more U.S. consumers to buy technology in and around the TV.
Specifically, 4K Ultra High Definition televisions experienced the largest growth in household ownership rate, rising 15 percentage points year-over-year to reach 31% households ownership. Some 19% of households owns a TV with a screen size of 60 inches or bigger. Ownership of digital media streaming devices rose nine percentage points since last year, to 45% of households.
“It’s no surprise that emerging categories such as smart speakers and VR are among the products consumers anticipate buying the most” said Ben Arnold, Senior Director of Innovation and Trends at CTA. “Many of these devices incorporate new technologies and features – artificial intelligence, voice recognition, faster processing – and at the same time provide a smarter way to communicate or experience content.”
#TBT
This year marks the 20th anniversary of CTA’s Annual Consumer Technology Ownership and Market Potential Study. It shows significant changes from 20 years ago. Going back to 1998, color TVs, VCR decks, cordless phones, telephone answering devices and home CD players made up the top five most-frequently owned tech products in U.S. households.
The 20th Annual Consumer Technology Ownership and Market Potential Study ascertains ownership and purchase intent of consumer technology products among U.S. households across various categories.
The report was administered via a dual-frame telephone interview to 2,016 U.S. adults between February 22 and March 5, 2018. It is designed and formulated by CTA Market Research, the most comprehensive source of sales data, forecasts, consumer research and historical trends for the consumer technology industry.
- Adjusted to represent most recent CTA data on smart speaker household ownership.


